The 2QZ is affected by incompleteness is a number of different ways. These are discussed in detail by Croom et al (2003) (Paper XII). Here we outline these completeness issues and supply the data and software required to make these corrections. We define four separate causes of incompleteness which are:
We discuss each of these in turn below. In several cases we specify completeness on a sector-by-sector basis where a sector is as a unique area defined by the interesection of a number of circular 2dF fields.
This falls into two catagories. The first concerns objects that are truly point sources but which have been mis-classified by the APM analysis software. The fraction of sources missed in this fashion is found to be:
fns=0.064+0.0052(bJ-16).
The second form of incompleteness, due to the effect of the AGN host galaxies is much harder to model, however we note that even the largest host galaxies (re~10 kpc) will have angular sizes of less that 2 arcsec at z>0.4. So at redshifts above z~0.4 we do not expect this to be an important issue. Due to the uncertainty in the properties of the host galaxies we choose not to make any specific correction for incompleteness due to this affect.
We derive the incompleteness due to QSOs moving out of our colour selection boundaries using a semi-empirical model which makes use of the mean colours of QSOs as a function of redshift and the measured dispersion in colour of the 2QZ QSOs. Full details are given in Croom et al (2003) (Paper XII).
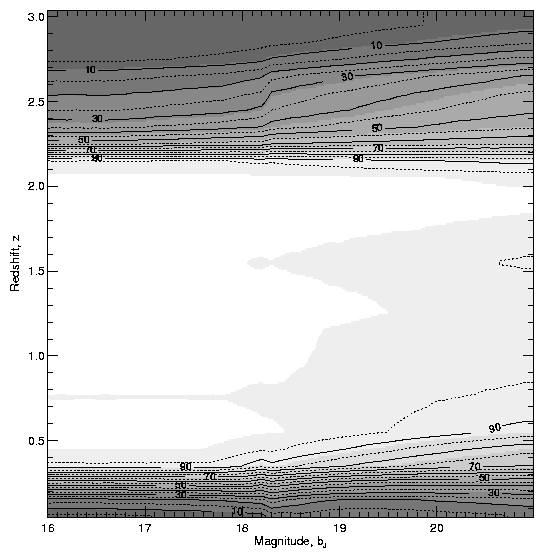
The resulting completeness map is a function of redshift and apparent bJ magnitude and is shown below:
The photometric completeness countours are plotted at 10 percent (solid lines) and 5 percent (dotted lines) intervals. This completeness map is given in tabular form here. A fortran program to read in the array and calculate completeness values is also provided.
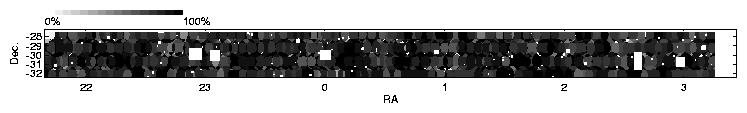
The coverage is defined as the fraction of 2QZ targets that were observed spectroscopically. A map of this, pixelized on a scale of 1 arcmin is available, as is the code required to produce the map (mask_mask.f). The full coverage maps for the two 2QZ survey strips are shown below (top NGP; bottom SGP):
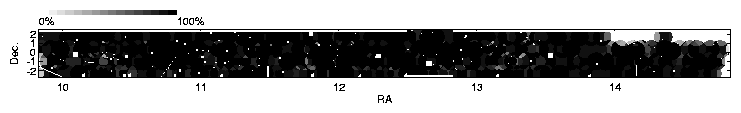
Spectroscopic completeness is a function of both area, magnitude and redshift. We first define the spectroscopic completeness across the 2QZ strips using a similar pixelized map to the coverage map above. This is also generated by the make_mask.f code. The combined coverage and spectroscopic completeness mask for the two stips is shown below:
Spectroscopic completeness is also a function of magnitude, being lower at the faintest apparent magnitudes observed. In a given sector the magnitude dependent spectroscopic completeness is by:
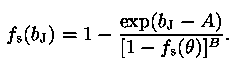
where A=20.388+-0.77 and B=-0.919+-0.052. fs(theta) is the spectroscopic completeness as a function of angular position (i.e. sector) described by the maps shown above. The combined spectroscopic completeness is then
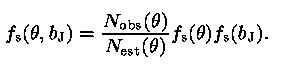
With
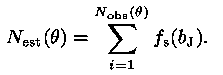
The ratio Nobs/Nest is also generated by the mask making code make_mask.f.
Finally there is also a redshift dependent component to the completeness such that full spectroscopic completeness is described by
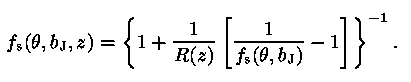
The function R(z) is given in tabular form in intervals on 0.1 in redshift, and can be found here. We note that there are significant random errors on the calculation of R(z).
The above area masks are defined on a sector-by-sector basis and then pixelized in 1x1 arcmin pixels. We provide both basic masks for the full catalogue and the mask making software that will allow masks with varying completeness thresholds to be made.
Originally the catalogue was defined in the the B1950 system. Subsequently revised positions have been obtained in the J2000 system tied to to the TYCHO-II reference frame. However, as all the field centres, holes and plate edges are defined in the B1950 system it makes sense to derive the completeness masks in this system also. For this reason the final released catalogue contains both B1950 and J2000 coordinates.
The maps for the full catalogue (without any cut in sector completeness) are available below. We have three separate mask files, containing the coverage completeness (the fraction of objects observed), the spectroscopic completeness (the fraction of observed objects with good IDs) and an estimate of the Nobs/Nest ratio described in the equations above. They are all in the same format, with the resulting masks being pixelized in 1'x1' bins (4510x320 pixels).
The files containing the masks contain six lines of header information:
| header | description |
| RA_min | centre of the first array element in RA (degrees) |
| Dec_min | centre of the first array element in Dec (degrees) |
| 4510 | number of RA pixels |
| 320 | number of Dec pixels |
| RA_step | RA step size (degrees) |
| Dec_step | Dec step size (degrees) |
The remainder of the file contains a 4510x320 real*4 array. There are two versions available, both written out as FORTRAN arrays. The first is an unformatted FORTRAN file that can be read using the following:
real array(4510,320),ramin,decmin,rastep,decstep
integer nra,ndec
open(unit.....)
read(unit) ramin
read(unit) decmin
read(unit) nra
read(unit) ndec
read(unit) rastep
read(unit) decstep
read(unit) array
close(unit)
Alternatively, there is a text file which can be read using:
open(unit.....)
read(unit,*) ramin
read(unit,*) decmin
read(unit,*) nra
read(unit,*) ndec
read(unit,*) rastep
read(unit,*) decstep
read(unit,*) array
close(unit)
There are separate coverage maps for the NGP (or equatorial) and SGP strips. Because the original 2QZ catalogue selection was based on B1950 coordinates, the maps are specified in B1950 coordinates:
NGP coverage map (B1950): unformatted
or ASCII
SGP coverage map (B1950): unformatted
or ASCII
NGP completeness map (B1950): unformatted
or ASCII
SGP completeness map (B1950): unformatted
or ASCII
NGP Nobs/Nest ratio map (B1950): unformatted
of ASCII
SGP Nobs/Nest ratio map (B1950): unformatted
of ASCII