2dF QSO Redshift Survey
Observational Results
| Number-magnitude | Number-redshift | Redshift slice |
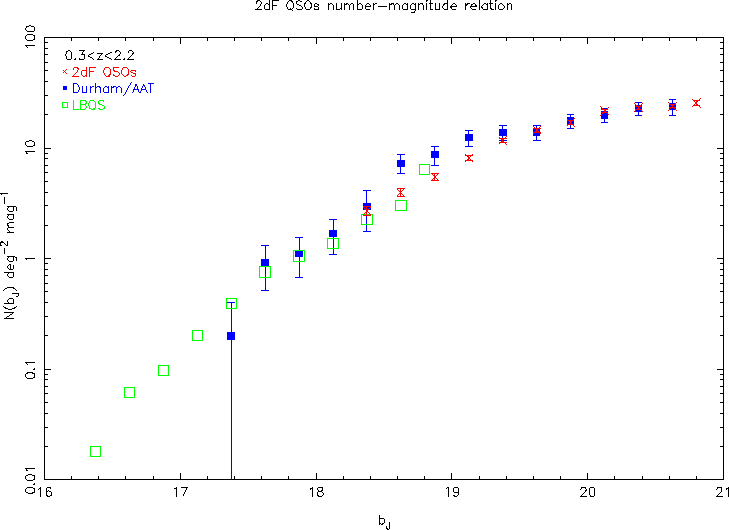
Number vs. Apparent magnitude Relation

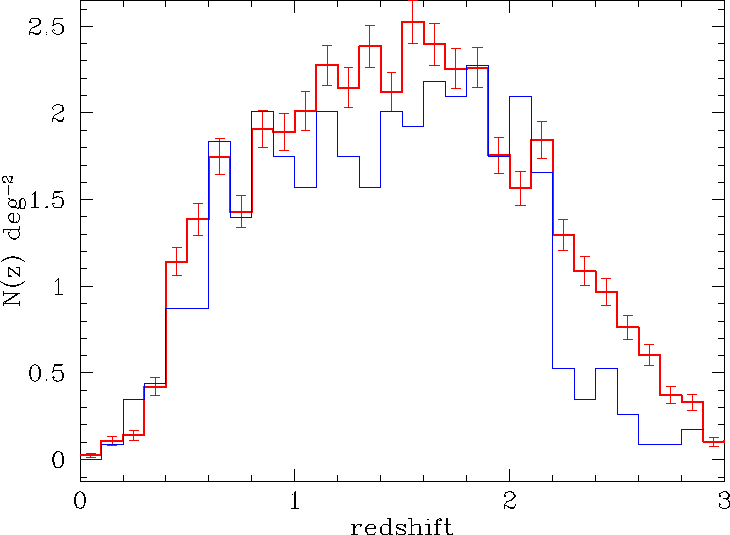
Number vs. Redshift Relation

This shows the redshift distribution of all our 2dF QSOs as of September 1999. The blue histogram is for the Durham/AAT QSO survey, which was purely UVX selected, Note how QSO selection in the range 2·2 < z < 3·0 is particularly improved with inclusion of R-band data.
There is also a rather older version which shows only the UVX QSOs (i.e., does not include the improved R-band selection).
