2dF QSO Redshift Survey
Figures for survey objectives
Sorry. I'm still writing the captions, so some of them are missing below

Figure 1:
The QSO-galaxy angular cross-correlation function w_{qg}(
 ) for the 169 z
 0·3 EMSS QSOs and APM B_J
 20·5 galaxies. The dashed curve is the angular B < 20·5 galaxy
auto-correlation function, w_{gg}(
 ), derived from the APM galaxy survey (Maddox et al. 1991).
The dotted lines indicate the ±2\sigma limits for the fit of w_{gg}(
 ) to w_{qg}(
 ). The agreement between the amplitudes of the two functions implies that the clustering properties
(and thus environments) of these QSOs are identical to those of galaxies.
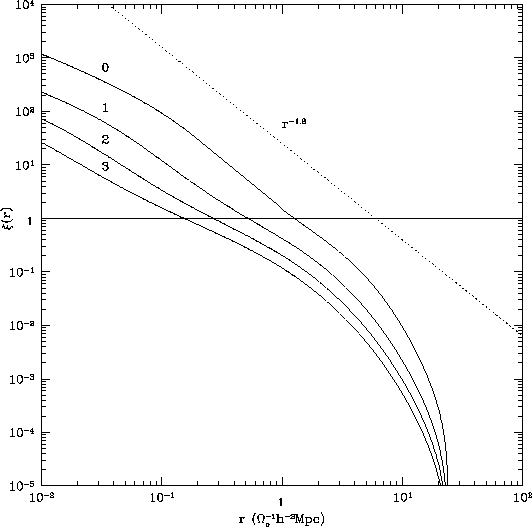
Figure 2:
 in an unbiased,
 = 1, CDM model for redshifts, z = 0, 1, 2, 3,
taken from Hamilton et al. (1991). A r^{-1·8}
power law (dotted line) is shown for comparison.
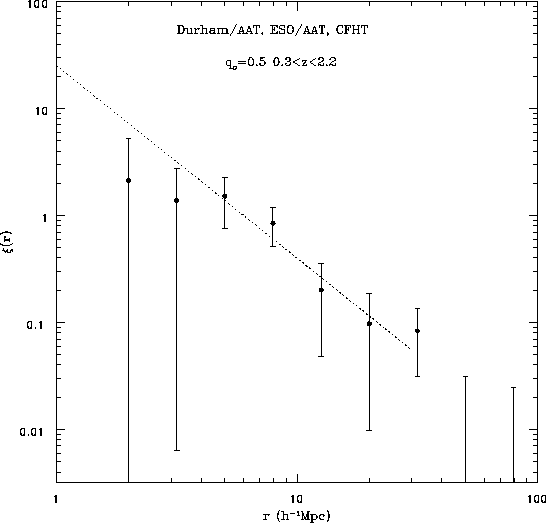
Figure 3:
The Durham/AAT, ESO/AAT and CFHT correlation function on small scales assuming q_0=0·5.
The dotted line corresponds to
 (r)=(r/r_0)^{-1·8} with r_0 = 6h
 Mpc (Shanks & Boyle 1994).
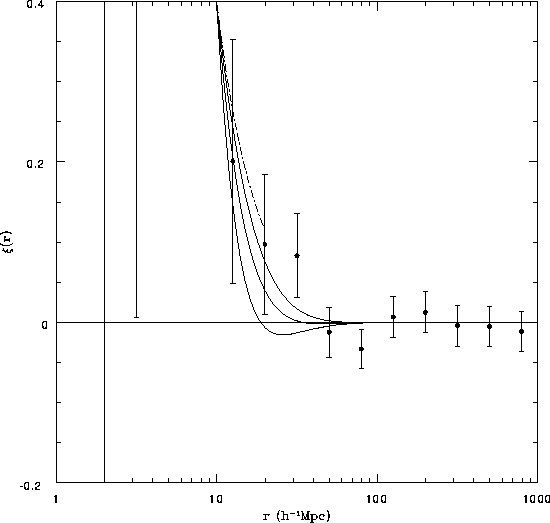
Figure 4:
 (r) for the Durham/AAT, ESO/AAT and CFHT on large scales. The dot-dashed and representative
line is a -1·8 power law with r_0 = 6h
 Mpc, similar to the APM correlation function (Maddox et al. (1991)). The solid lines are
 = 1, CDM correlation functions (from Holtzmann 1989) normalized to the detected QSO
correlation function within 10h
 Mpc, with h = 0·5 and n = 0·5, 1 and 1·5 (top to bottom), the
middle solid line corresponding to standard CDM.
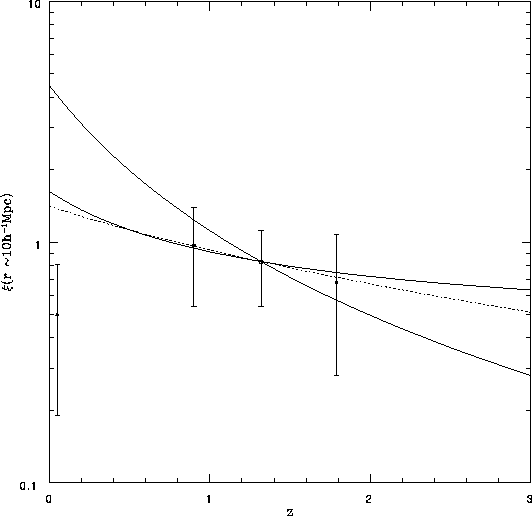
Figure 5:
The amplitude of
 at r
at r
 10h
10h
 Mpc. The evolution of the amplitude of
 is predicted under three simple linear evolution models which include the effect of biasing after
Bardeen et al (1986). The solid lines represent
 = 1
with b = 1 (steeper curve) and b = 2 (shallower curve). The dotted line
represents
 = 0·1, b = 1. The points plotted are estimates of
 at approximately the 10h
 Mpc scale taken from current surveys (see Shanks & Boyle 1994). With a ×50
increase in the sample size we shall be able to distinguish between an
 = 1 with 1
 b
b
 1·5 and the unbiased open model.
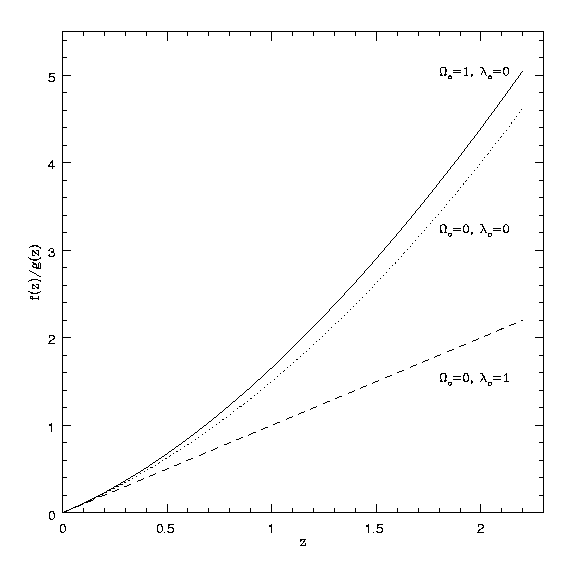
Figure 6:
An illustration of how the ratio of angular to radial distances varies as a function of z
for different cosmological models. We plot f(z)/g(z), where the co-moving distance (r)
between two QSOs separated by
 z in the redshift direction and

 in the angular direction is given by r² = g²
  z² + f²
 ².
It can be seen that at high z there is a large difference between the
 =1 (
=1 (
 =
=
 c² / 3H_0²) and the
 =0 models (Phillipps 1994).
| Back to Survey Objectives |
| Home
| Contact Addresses |
Robert J. Smith, rjs@astro.livjm.ac.uk
Last modified: Fri Mar 30 11:20:30 BST 2001
This site is kindly hosted by
Astrophysics Research Institute
of
Liverpool JMU.
 ) for the 169 z
 0·3 EMSS QSOs and APM B_J
 20·5 galaxies. The dashed curve is the angular B < 20·5 galaxy
auto-correlation function, w_{gg}(
 ), derived from the APM galaxy survey (Maddox et al. 1991).
The dotted lines indicate the ±2\sigma limits for the fit of w_{gg}(
 ) to w_{qg}(
 ). The agreement between the amplitudes of the two functions implies that the clustering properties
(and thus environments) of these QSOs are identical to those of galaxies.


 z in the redshift direction and
 =1 (
=1 (
 c² / 3H_0²) and the