2QZ Results
This is simply to be a grab bag of recent preliminary results, plots and
points of interest which we want to make public. Unless stated otherwise,
anything which appears
here should be considered a work in progress. For actual published results,
please see our list of
2QZ publications.
Example Spectra
See also Whole Survey Stacks below
- From our first observing run.
- QSOs in the rest frame. This
PS plot and this
gif version
show ten QSOs at various redshifts each
projected back to its rest wavelength and then compared with a composite spectrum. They
demonstrate how we observe a different section of the QSO spectrum
depending on its redshift. For very distant objects the ultra-violet
part of the spectrum has been redshifted into the visible and is what we observe.
For very low redshift QSOs, we can actually observe the visible wavelengths. The
composite at the bottom of the figure was created by adding together 10000 spectra,
thereby creating one mean spectrum which covers the full wavelength range. The ten spectra
are available individually, in their observed frame below.
- Various example spectra in gif and PS formats.
- Postscript plot
of some QSOs and
galaxies
taken from an
AAO Newsletter
article.
QSO Clustering
This is currently an area of very active work and we hope new results will appear
here soon. For the time being, we suggest you look at the
on-line version of the talk
Scott Croom gave at the 1999 Coral Sea Cosmology meeting. Please bear in
mind though that this is still a work in progress and it would
be best not to quote results presented here without first talking to the
authors.
Luminosity Function
The survey's impact is not restricted to cosmology. The luminosity
function, (i.e., the abundance of QSOs as a function of their
luminosity or intrinsic brightness) is an important way of parameterising
the population. Any model seeking to describe QSO formation and fuelling
mechanisms must be able to reproduce the observed population and its
evolution with redshift. The 2QZ has allowed the measurement of QSO
evolution in unprecedented detail. The
accompanying figure
shows the optical luminosity function (OLF) for ten separate data subsets divided by
redshift. The evolution as a function of redshift is obvious and over the
redshift range 0·35 < z < 2·3 is acceptably fit by pure luminosity
evolution (PLE). That is, the form of the OLF does not vary with redshift, but is simply
shifted to higher luminosity. The shape and evolution
at low redshifts (z<0·5) and high luminosities are not currently well
sampled by the 2QZ, but may show departures from PLE. We hope to address
this issue in more detail with the complete 2QZ catalogue, supplemented with
our own FLAIR/6dF QSO survey.
The OLF results are published in The 2dF QSO Redshift Survey - I. The Optical Luminosity Function,
B.J. Boyle, T, Shanks, S.M. Croom, R.J. Smith, L. Miller, N. Loaring, C. Heymans, MNRAS accepted,
astro-ph/0005368
Number Counts
Catalogue Contamination / Non-QSOs
Example Spectra above contain a few examples of non QSO objects.
Misc. Pretty Plots
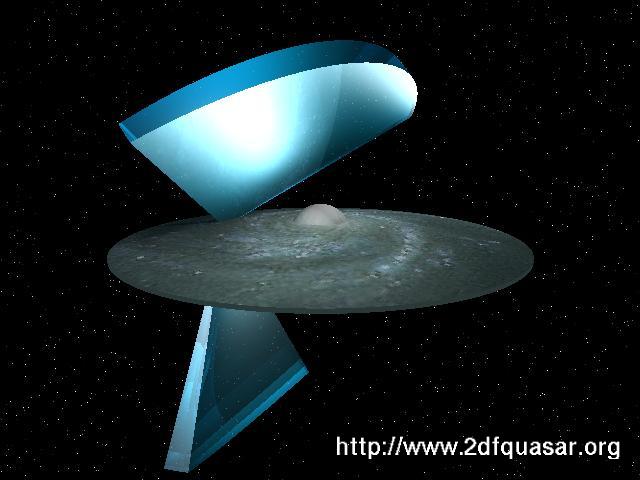
- Survey geometry `glass wedge' plots.
- The latest wedge plot
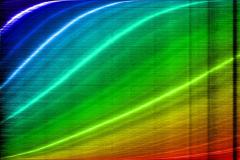
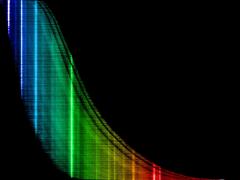
- Whole Survey Stacks
Rest frame, 10000 QSOs, monochrome, features labelled, 640x512 pix
Observed frame, 10000 QSOs, monochrome, features labelled, 640x512 pix
Observed frame, 20000 QSOs, 8bit colour gif, unlabelled, 640x336 pix
Observed frame, 20000 QSOs, gzipped 24bit colour tif, unlabelled, 2000x1050 pix, 6Mb!!
Observed frame, 20000 QSOs, 24bit colour jpg, unlabelled, 2000x1050 pix
Rest frame, 20000 QSOs, 8bit colour gif, unlabelled, 640x336 pix
Rest frame, 20000 QSOs, gzipped 24bit colour tif, unlabelled, 2000x1050 pix, 6Mb!!
Rest frame, 20000 QSOs, 24bit colour jpg, unlabelled, 2000x1050 pix
Rest frame, 10000 QSOs, 24bit colour tif, features labelled, 640x512 pix
Rest frame, 10000 QSOs, 8bit colour gif, features labelled, 1142x871 pix
These give a feeling for what I can easily produce. Let me know if you need a particular combination of
resolution, colour depth, labelling etc.


